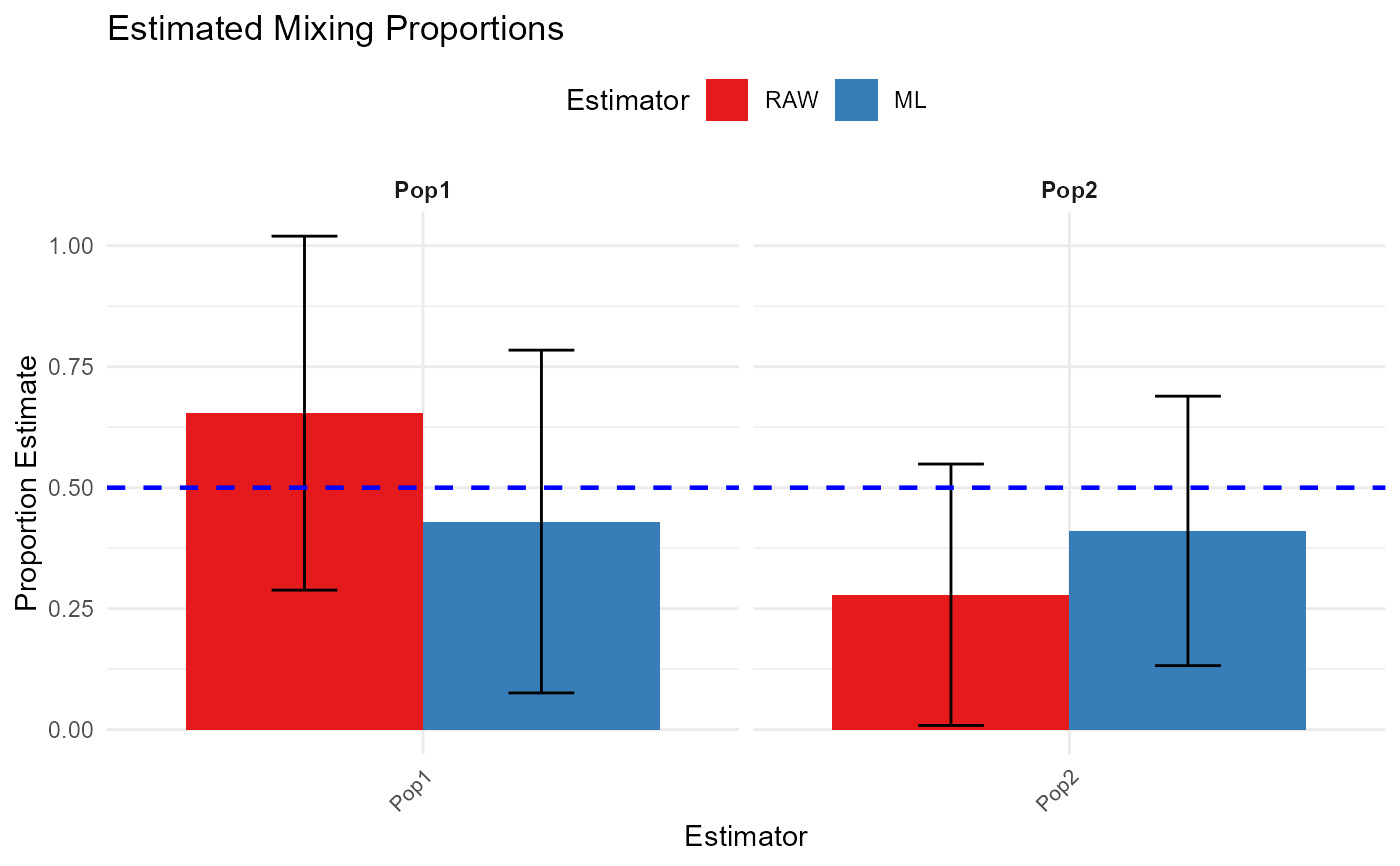
Plot HISEA theta estimates with error bars utils::globalVariables(c("Stock", "Mean", "Estimator", "SD", "ActualValue"))
Source:R/results.R
plot_hisea_theta.RdPlot HISEA theta estimates with error bars utils::globalVariables(c("Stock", "Mean", "Estimator", "SD", "ActualValue"))
Examples
# 1. Generate a summary report first
nsamps <- 5; np <- 2; nest <- 2
est_array <- array(runif(nsamps * np * nest), dim = c(nsamps, np, nest))
dimnames(est_array) <- list(NULL, c("Pop1", "Pop2"), c("RAW", "ML"))
rep <- create_hisea_summary_report(est_array, run_type = "ANALYSIS")

# 2. Plot results
if (requireNamespace("ggplot2", quietly = TRUE)) {
  p <- plot_hisea_theta(rep, actual_proportions = c(0.5, 0.5))
  print(p)
}
#> Warning: Using `size` aesthetic for lines was deprecated in ggplot2 3.4.0.
#> ℹ Please use `linewidth` instead.
#> ℹ The deprecated feature was likely used in the RHISEA package.
#>   Please report the issue at <https://github.com/SostheneA/RHISEA/issues>.